Shopify Returns Management: The Complete Guide (2026)
 Written byAyushi Tyagi
 Reviewed byAnuj Goel
Shopify returns management is how your store takes a return request, checks it against your rules, gets the item back and closes it with a refund, an exchange or store credit. It deserves a plan, because returns are a large share of online orders. For example, the National Retail Federation (NRF) estimated that 19.3% of online sales would be returned in the US in 2025.
This guide shows what Shopify does without an app, where it stops and how to set up each step. COD, RTO and return labels each get a section. The same ideas apply to ecommerce returns management on any platform. However, every setting named here is a Shopify one.
Key takeaways
- Shopify covers the basics without an app: returns from the Orders page, return rules, self-serve requests, refunds and store credit.
- Its limits are documented. For example, self-serve returns cannot take exchange requests, and Shopify creates return labels only for US stores shipping to US customers.
- Set your return rules before order volume grows, because rule changes apply only to future orders.
- Show the exchange or store credit option before the refund, but keep the refund easy to find.
- Indian stores need a written plan for COD refunds, RTO and reverse pickup.
In this guide:
- What is Shopify returns management?
- What is ecommerce returns management?
- Returns numbers every Shopify store should know
- How Shopify handles returns natively
- Where native Shopify returns stop
- How to set up Shopify returns management, step by step
- When a Shopify returns app makes sense
- Refund, exchange or store credit: an exchange-first returns process
- Returns management in India: COD, RTO and reverse pickup
- Returns management in the US: labels, windows and free returns
- Return fraud and policy abuse
- What a return really costs, and the numbers to track
- How QuickReturns handles Shopify returns management
- Frequently asked questions
What is Shopify returns management?
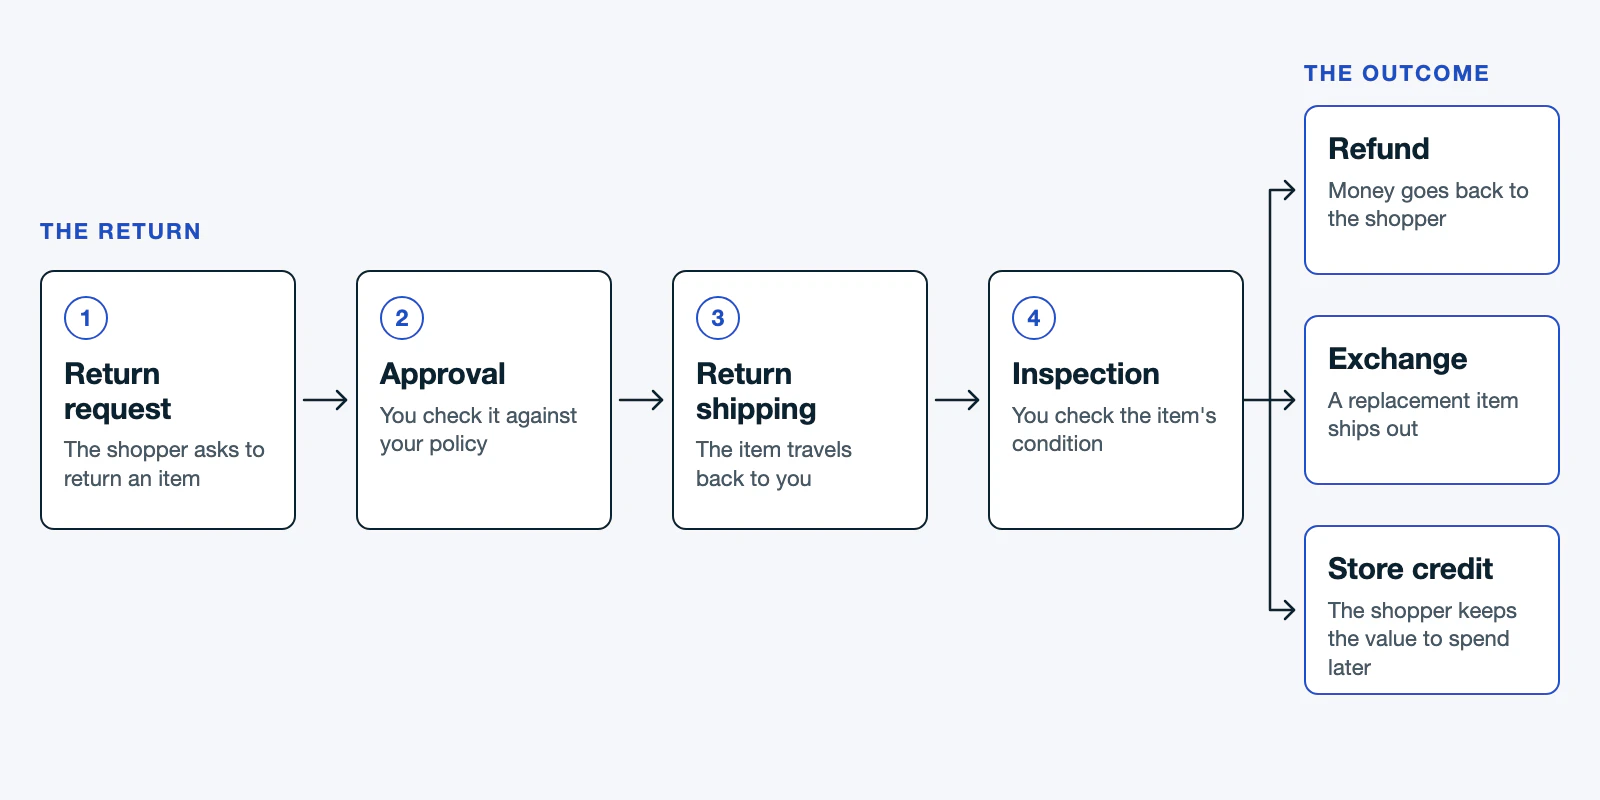
Shopify returns management is the process a Shopify store uses to handle a return, from the first request to the final refund, exchange or store credit. It covers who can return what, how the item travels back, what the customer receives and what happens to the stock afterwards.
In practice, the process has five parts:
- Request. The customer asks to send something back, by email, from their account or through a returns portal.
- Eligibility rules. Your return window, final sale items and fees decide whether you approve the request.
- Return shipping. A label, a courier pickup or the customer’s own shipment brings the item back.
- Resolution. You close the return with a refund, an exchange or store credit.
- Restock and reporting. You inspect the item, restock what you can sell again and record the reason.
You can do each part by hand in the Shopify admin. However, every manual step takes more of your time as orders grow. So it helps to know which parts Shopify already handles for you.
What is ecommerce returns management?
Ecommerce returns management is the same process on any online store. You accept return requests, apply a return policy, move the goods back to your warehouse, and then refund or exchange the order. It also includes tracking why items come back, so that fewer of them do.
The steps stay the same whether you sell on Shopify, on a marketplace or on a custom site. The tooling is what changes. On Shopify, for example, the request, the rules and the refund all sit on the order in your admin. Therefore this guide stays with Shopify settings and names the limits you will meet.
Returns numbers every Shopify store should know
Before you change a setting, look at the scale of the problem. The figures below come from the NRF 2025 retail returns press release, published in October 2025. They describe US retail as a whole, so treat them as context for Shopify returns management, and compare them with your own store.
- Retailers estimated that 15.8% of their annual sales would be returned in 2025, totalling $849.9 billion.
- For online sales, the estimate was 19.3%.
- 82% of shoppers called free returns a major consideration when they buy, up from 76% a year earlier.
- 76% said they are more likely to choose a return option that gives an instant refund or exchange.
Two things follow from these numbers. First, returns are a normal cost of selling online, so plan for them. Second, shoppers read your return terms before they buy.
We have not found a comparable primary source for India. As a result, this guide gives no India percentages. Instead, measure your own return rate by product, as the metrics section below explains.
How Shopify handles returns natively
Shopify has returns built into the admin. According to the Shopify Help Center returns overview, you manage returns and exchanges from the Orders page. Below are the four pieces you can use before you install anything.
Create a return from the Orders page
First, open the order, choose the items and create a return. Then send the customer shipping instructions. After the item arrives and you have inspected it, issue the refund. However, Shopify notes that you can create a return only for fulfilled items that haven’t been refunded.
For return shipping, you can upload a label you already have. Shopify can also create the label for you. That option, though, works only when your primary location and the customer’s shipping address are both in the United States.
Self-serve returns and cancellations
With Shopify’s self-serve returns feature, customers ask for a return from their account page, so they no longer need to email you. You turn it on under Settings, then Customer accounts, as the self-serve returns setup guide explains. The request then reaches you in the admin.
There are two conditions. First, your store must use the new customer accounts, because self-serve returns don’t work with legacy customer accounts. Second, a single request can hold up to 250 line items.
Return rules
Return rules decide which items are eligible and how long customers have to ask. In the return rules settings, you set four things:
- Return window: 14, 30 or 90 days, unlimited, or a custom number of days.
- Return shipping cost: free return shipping, a flat fee charged once per return, or the customer buys their own label.
- Restocking fee: a fee you charge on returned items.
- Final sale items: products or collections that can’t be returned.
Rules only work when customers can read them. So also write a clear return policy and link it where shoppers will see it.
Refunds, store credit and exchanges
When you refund an order, Shopify says you can refund to the original payment method, store credit, or both. Store credit comes with one condition. Customers can spend it only when they are signed in through customer accounts or paying with Shop Pay, according to the Shopify store credit page. For the trade-offs, see our guide to store credit vs refunds.
An exchange, meanwhile, is part of the return. In Shopify’s words, you send the customer “an alternative item as part of the return, such as a different size or color”. You add that item yourself when you process the return.
Where native Shopify returns stop
The native tools cover the basics well. Still, each one has a limit, and Shopify documents every limit itself. The table below lists them, so you can check each against how your store works.
| Area | What native Shopify does | Where it stops |
|---|---|---|
| Self-serve requests | Customers request a return from their account | Exchanges can’t be requested in self-serve returns, and you can’t set exchange-specific return rules |
| Customer accounts | Self-serve returns work with the new customer accounts | They don’t work with legacy customer accounts |
| Return labels | You create a label in the admin, or upload one you already have | Label creation needs your primary location and the customer’s address to both be in the United States |
| Return fees | You set a restocking fee and a return shipping fee in return rules | Return fees aren’t automatically deducted from refunds |
| Rule changes | You can edit return rules at any time | Changes apply only to future orders |
| Exchanges | You add exchange items to a return in the admin | You can’t add custom items as exchange items |
| Store credit | You refund to store credit, alone or with the original payment method | Store credit isn’t available for legacy customer accounts |
Sources: Shopify Help Center pages on creating returns, self-serve returns, return rules and store credit.
For many stores, none of these limits gets in the way. However, two groups feel them early. The first is stores that want shoppers to choose an exchange without staff help. The second is stores that would rather shoppers start a return without signing in to a customer account.
How to set up Shopify returns management, step by step
You can set up Shopify returns management in an afternoon. Follow these seven steps in order, because each one builds on the step before it.
Step 1: Write the return policy
Start with the policy, because every later setting copies it. State the return window, the items you exclude, who pays for return shipping and how you pay refunds. If you need a first draft, use our free return policy generator and then edit the result to match your store.
Step 2: Set your return rules
Next, enter the same terms as return rules in your Shopify settings: the window, the shipping cost, the restocking fee and any final sale items. Remember that rule changes apply only to future orders. So set them before a sale starts, while there is still time.
Step 3: Turn on self-serve returns
Then go to Settings, open Customer accounts and turn on self-serve returns and cancellations. Check first that your store uses the new customer accounts. Otherwise the feature will not work.
Step 4: Decide how items come back
US stores shipping to US customers can create a return label in Shopify. Everyone else has two options. You can upload a label from your courier, or you can book a pickup with the courier directly. Whichever you choose, write the customer instructions once and then reuse them.
Step 5: Inspect and restock
When the parcel arrives, check the item against the reason the customer gave. After that, restock what you can sell again and set aside what you can’t. Shopify’s own flow follows this order too, because you refund after you inspect the returned items.
Step 6: Refund, credit or exchange
Now close the return with the outcome your policy promises. Because Shopify does not deduct return fees automatically, subtract any restocking or shipping fee yourself when you enter the refund amount. If the customer wants an exchange, add the new item to the return in the admin.
Step 7: Log return reasons and review them monthly
Finally, record why each item came back. Once a month, sort the reasons by product. For example, a size complaint that repeats on one product usually points to its size chart. In that case, fix the product page before you tighten the policy.
When a Shopify returns app makes sense
The native tools are enough for many small stores. However, a Shopify returns app starts to earn its fee when one of these is true:
- You want shoppers to request an exchange themselves, and Shopify’s self-serve returns can’t take exchange requests.
- You want return labels generated automatically, instead of creating or uploading each one by hand.
- You need different handling by product, return reason or payment method.
- Manual approval has become slow at your order volume.
- You want return reasons reported without keeping a spreadsheet.
Shopify’s developer documentation describes what returns apps add on Shopify: “a customer self-serve portal, rules to identify eligible items for a return, exchanges and refunds to store credit, automated workflows, and more”. It also gives examples of those workflows, such as auto-approval, auto-restocking and auto-refunds.
Time is the other reason. In our experience with merchants, a return handled over email can take an hour or two of back-and-forth. A request through a portal, on the other hand, takes minutes.
The QuickReturns Shopify returns app is one option. For a wider look, compare the best returns apps for Shopify, or read our list of returns apps for Indian Shopify stores. If you are weighing two apps, see how QuickReturns compares with Return Prime. We also have a post with Loop, AfterShip and QuickReturns compared.
You can try a returns portal on your own store first. The QuickReturns Free plan covers 10 return requests a month.
Refund, exchange or store credit: an exchange-first returns process
A refund ends the sale. An exchange or store credit, on the other hand, keeps the revenue in your store. That is why many stores show the exchange option first.
Speed matters here as well. In the NRF consumer survey, 76% of shoppers said they are more likely to choose a return option that gives an instant refund or exchange. So make the exchange faster than the refund, and never force it. For example, you could issue store credit as soon as you approve the request, while a refund waits for inspection.
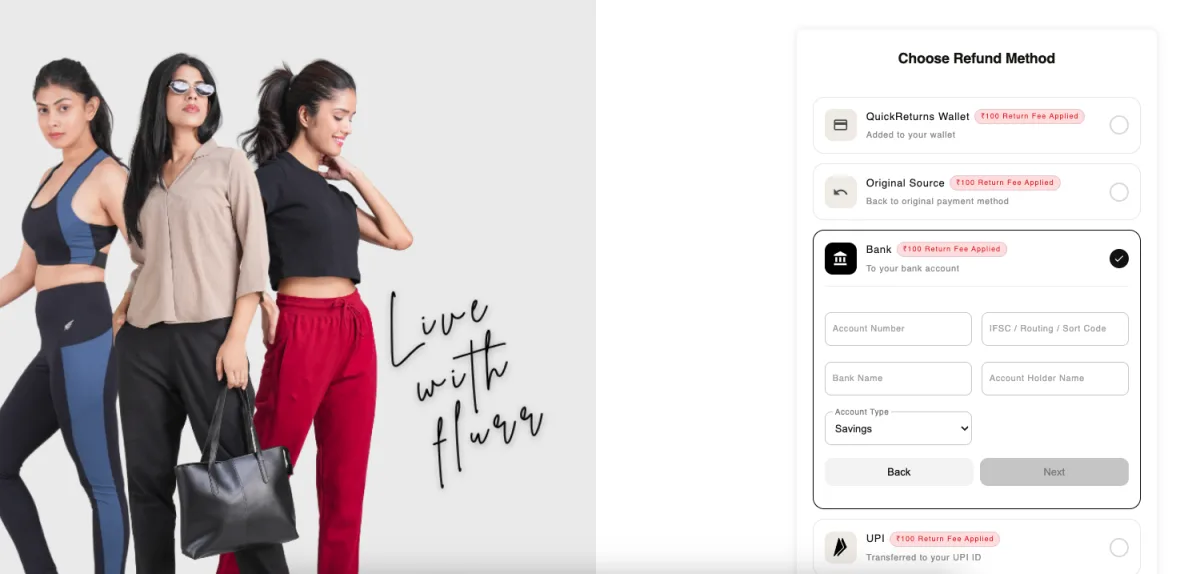
Avoid dark patterns, though. Hiding the refund option, adding extra steps or switching a shopper to store credit without asking may lift your numbers for a month. After that, it costs you the customer’s trust. A shopper who wants their money back should still find the refund in one tap.
We cover the reasoning in our post on exchange-first return flows. For practical ideas, see these exchange strategies that protect profit. If you use QuickReturns, the ConvertX page covers this step.
Returns management in India: COD, RTO and reverse pickup
Shopify returns management in India has three extra parts that most US guides skip: cash on delivery, RTO and reverse pickup. Each one needs its own written rule.
Customer returns and RTO are different problems
A customer return starts after delivery. The shopper received the order and now wants to send it back. RTO (return to origin) happens earlier: the shopper refused the order or the courier could not deliver it, so the parcel comes back to you.
Consequently, the fixes differ. Return rules, exchanges and store credit help with customer returns. RTO, on the other hand, is a delivery and order-confirmation problem. Track the two separately, because otherwise one hides the other. We explain why COD orders get returned more in a separate post.
Refunds on COD orders
Shopify lists cash on delivery as a manual payment method. It also lets you refund an order to store credit. So decide in advance how you refund a COD order, and write that into your policy. Shoppers will ask, because they paid the courier in cash.
Whatever tool you use, keep separate written rules for COD and prepaid orders. For example, state the refund method and the timing for each. Clear terms matter, as our post on what Indian shoppers expect from returns shows.
Reverse pickup instead of return labels
Shopify creates return labels only when the store and the customer are both in the United States. Therefore Indian stores book a reverse pickup with their courier, or upload the courier’s label to the return. Tell the customer the pickup date and how to pack the item. Then confirm once the courier has collected it.
On the QuickReturns side, we wrote a post about reverse pickups through RapidShyp. In addition, our courier and helpdesk integrations page shows what else connects.
Returns management in the US: labels, windows and free returns
In the US, Shopify returns management leans on the native tools, because label creation works for US-to-US returns. Four decisions remain.
First, decide who pays for return shipping. Shopify’s return rules give you three choices: free return shipping, a flat fee charged once per return, or the customer buys their own label.
Second, weigh free returns against your margin. In the NRF returns report summary, 82% of shoppers called free returns a major consideration when they buy. A flat fee protects margin, but it may cost you some orders. So test it on your own store before you commit.
Third, pick a return window and keep it simple. Shopify offers presets of 14, 30 and 90 days, plus unlimited and custom options. Whichever you pick, state it the same way in your policy and your return rules.
Finally, plan for the holidays. Retailers told the NRF that they expect 17% of holiday sales to be returned. As a result, you should line up inspection and refund capacity for January before the season starts.
Whatever you decide, give shoppers one place to start a return. A self-service returns portal does that under your own branding.
Return fraud and policy abuse
Most returns are honest. Even so, the NRF report on 2025 returns found that 9% of all returns are fraudulent. In the same release, close to two-thirds of consumers admitted to at least one costly returns behaviour. These are the common patterns:
- Wardrobing: buying an item, using it once and sending it back.
- Bracketing: ordering several sizes or colours and returning most of them.
- Empty box or wrong item: returning a parcel that doesn’t contain the product sold.
- Serial returning: one account that returns most of what it orders.
- Label fraud: claiming a refund for a return that never shipped.
Segment your policy, so that honest customers are not punished. Keep the easy path for shoppers with a clean history. Meanwhile, tighten the terms for accounts that show these patterns. For example, ask for photo proof, inspect before you refund, or offer store credit only.
Larger retailers go further. In the NRF survey, 85% said they use AI to detect or prevent return fraud. A small store does not need that yet. However, it does need return reasons and return counts per customer, because you can’t spot a pattern you never recorded.
What a return really costs, and the numbers to track
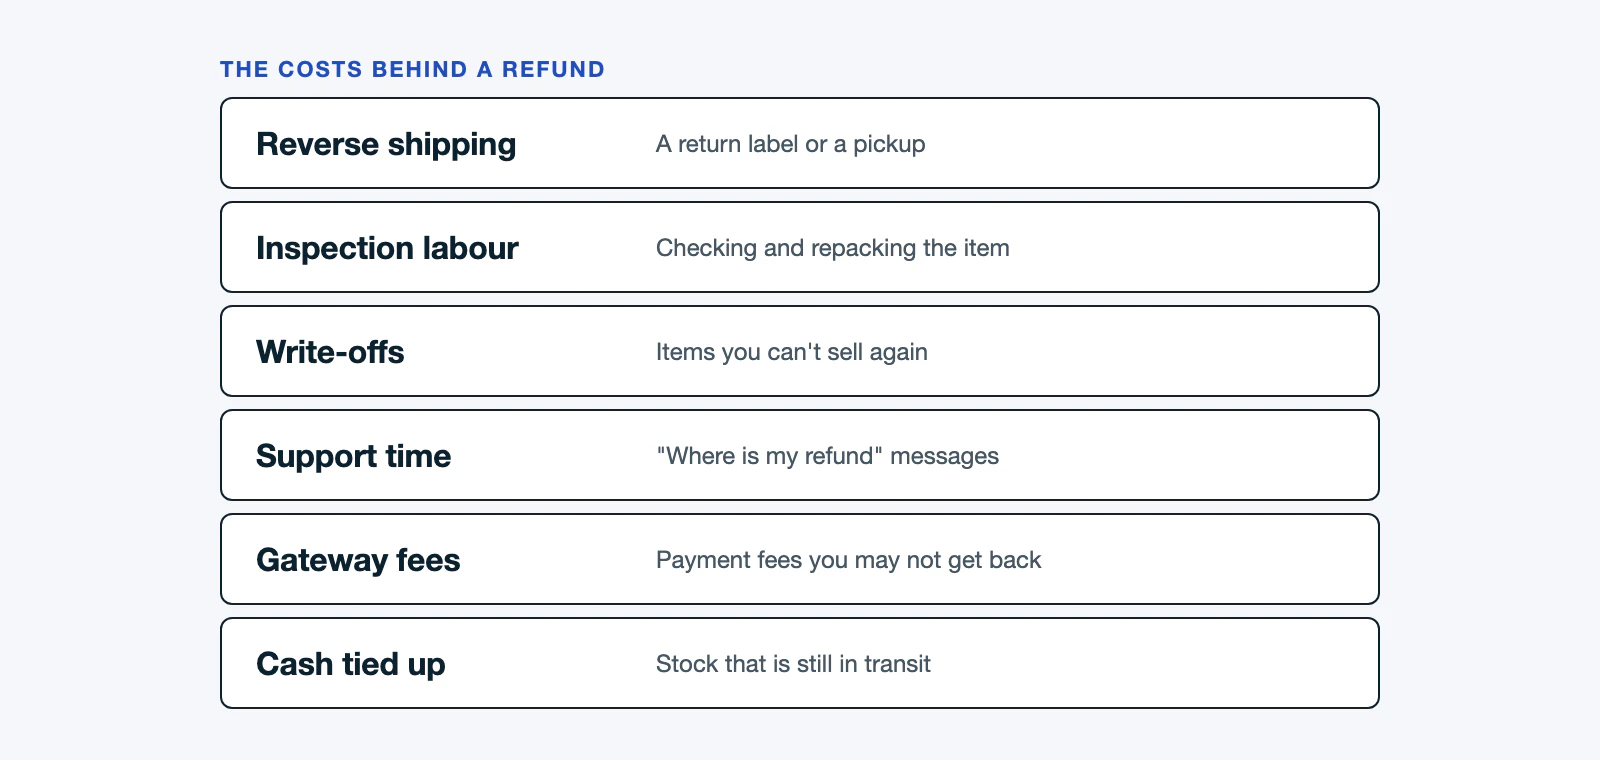
The refund is only the visible part of the cost. A return also costs you in other ways:
- Reverse shipping, whether you pay for a label or a pickup.
- Labour for inspection and repacking.
- Write-offs for items you can’t sell again.
- Support time spent on “where is my refund” messages.
- Payment gateway fees that you may not get back.
- Cash tied up while the stock is in transit.
We give no per-return figure here, because we found no primary source that fits Shopify stores. Instead, measure your own costs. In the end, good ecommerce returns management comes down to five numbers:
| Metric | How to work it out |
|---|---|
| Return rate by product | Units returned ÷ units sold, for each product and category |
| Cost per return | Total returns cost (shipping, labour, write-offs) ÷ number of returns |
| Revenue kept | (Exchange value + store credit issued) ÷ value of returned items |
| Time to refund | Average days from the return request to the refund |
| Top 5 return reasons | Count of returns for each reason, every month |
Review these numbers every month, and act on the one that moved most. That habit does more for Shopify returns management than any single setting. Our post on the support cost of returns covers the ticket side in detail. If approvals are the slow part, you can automate return approvals with rules.
How QuickReturns handles Shopify returns management
QuickReturns is a returns app for Shopify that 1,000+ brands use. Here is how it handles Shopify returns management.
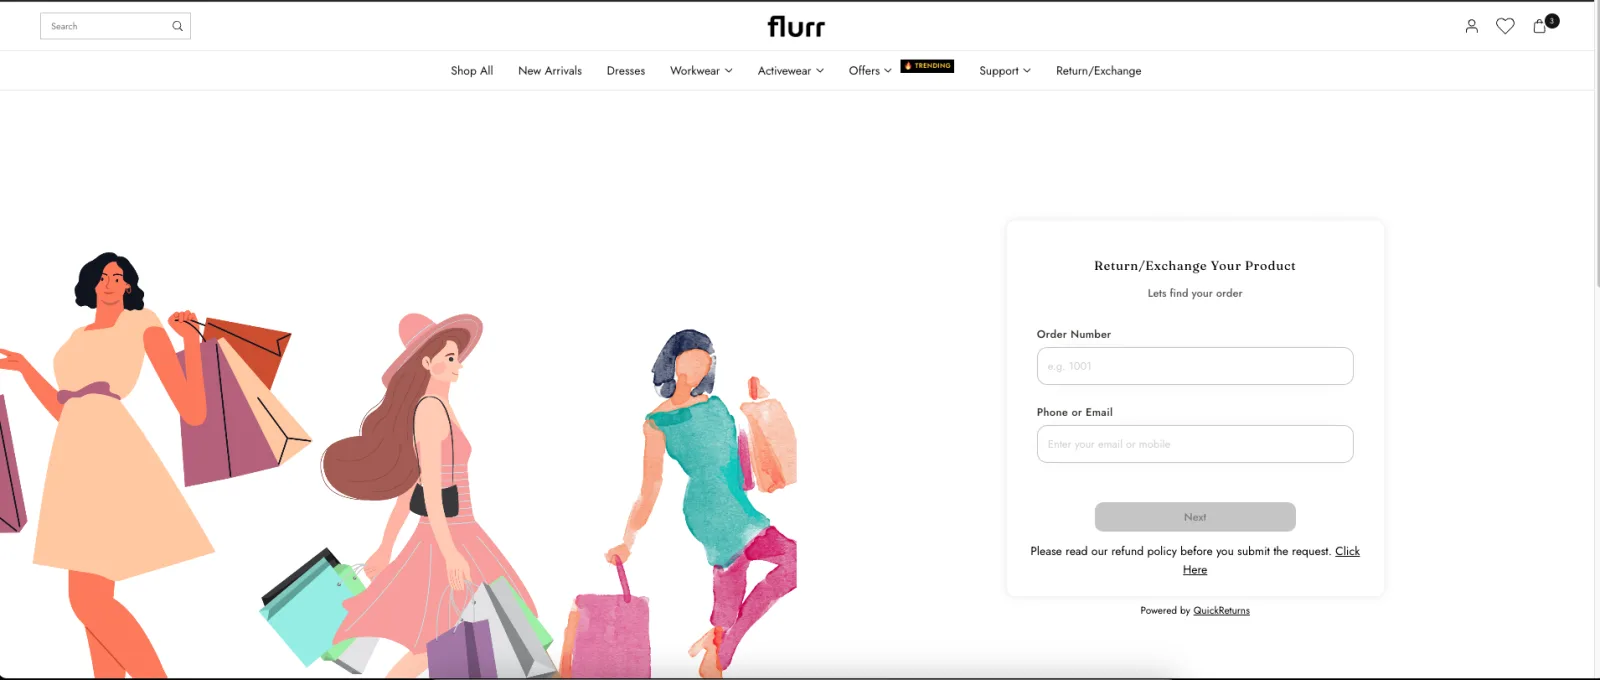
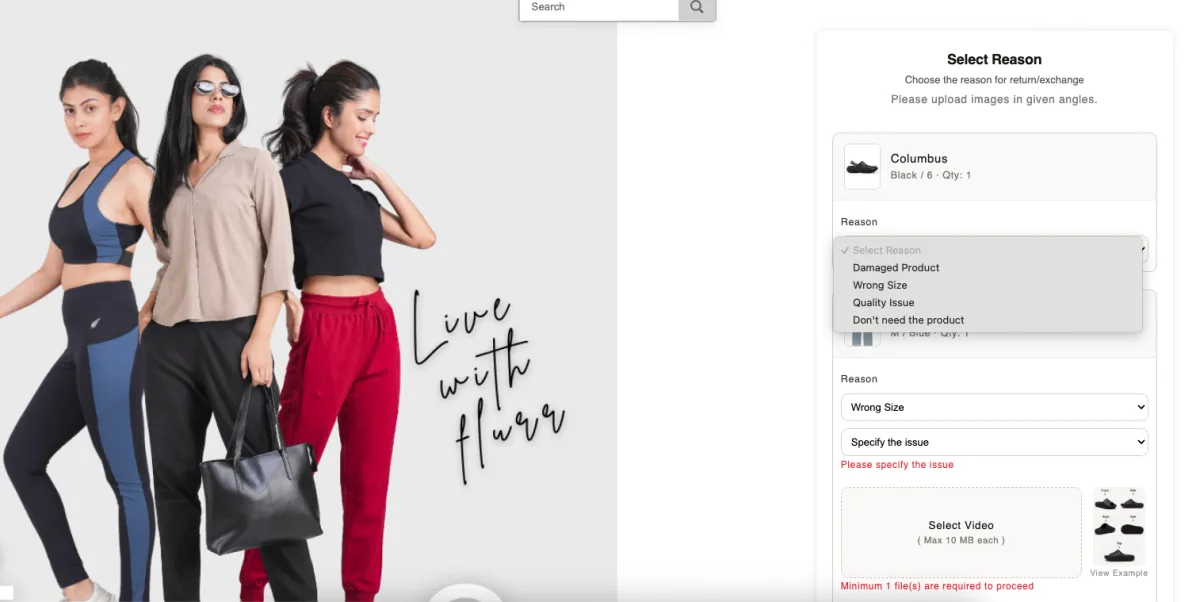
Shoppers start in a returns portal that carries your logo and brand colour. First, they look up the order with the order number plus their email or phone. Then they choose the items and pick a return reason. If you require it, they also upload a photo or video as proof.
After that, shoppers choose how they want their refund: store credit, the original payment method or a bank transfer. If you charge a return fee, the portal shows it before they confirm. They also get updates by email, and by SMS or WhatsApp once you connect a provider.
On your side, you approve requests manually or automatically with rules. The portal itself comes in 15 languages, including English, French, Spanish, German and Arabic.
Pricing follows your monthly request volume. In addition, every paid plan includes every feature, so the paid plans differ only by volume.
| Plan | Price a month | Requests included | Extra requests |
|---|---|---|---|
| Free | $0 | 10 | None. The plan stops at 10 |
| Growth | $19 | 60 | $0.40 each |
| Boost | $49 | 300 | $0.30 each |
| Scale | $99 | 500 | $0.20 each |
| Custom | Agreed on a call | 500+ | Set per brand |
See QuickReturns pricing for the full plan details.
Try the portal on your own store with the Free plan, or ask us to walk you through it.
Frequently asked questions
FAQs about native Shopify returns
Yes. Shopify lets you create a return from the Orders page, send shipping instructions and refund after inspection. It also has return rules for the window, the shipping cost and the restocking fee, plus self-serve returns from customer accounts. However, self-serve returns can’t take exchange requests, and label creation is limited to US stores with US customers.
In your Shopify admin, go to Settings, then Customer accounts, and turn on self-serve returns and cancellations. Your store must use the new customer accounts, because the feature doesn’t work with legacy accounts. Set your return rules first, so that every request meets the right window and fees.
No. The Shopify Help Center states that exchanges can’t be requested in self-serve returns, and you can’t set exchange-specific return rules. Instead, you add the exchange item yourself when you process the return in the admin. Stores that want shoppers to choose an exchange on their own usually add a returns app.
No. Shopify creates return labels only when your primary location and the customer’s shipping address are both in the United States. Indian stores therefore book a reverse pickup with their courier, or upload the courier’s label to the return. Either way, send the customer clear packing and pickup instructions.
FAQs about return rates and refunds
The National Retail Federation estimated that 19.3% of online sales would be returned in 2025. That figure covers US retail, and the estimate for all retail sales was 15.8%. Your own rate depends on what you sell, so track it by product. We have not found a comparable primary figure for India.
Offer all three where you can, and show the exchange or store credit first. Shopify lets you refund to the original payment method, store credit, or both. An exchange or store credit keeps the sale in your store. However, the refund must stay easy to find, or shoppers will stop trusting your policy.
Install QuickReturns from the Shopify App Store to set this up on your store. If you would rather talk first, book a call and we will go through your returns setup together.
